Enter a gene symbol into the relevant question input form and the provided information or resource will be shown.
Query a Single Gene across Curated Diabetes-Related Signatures
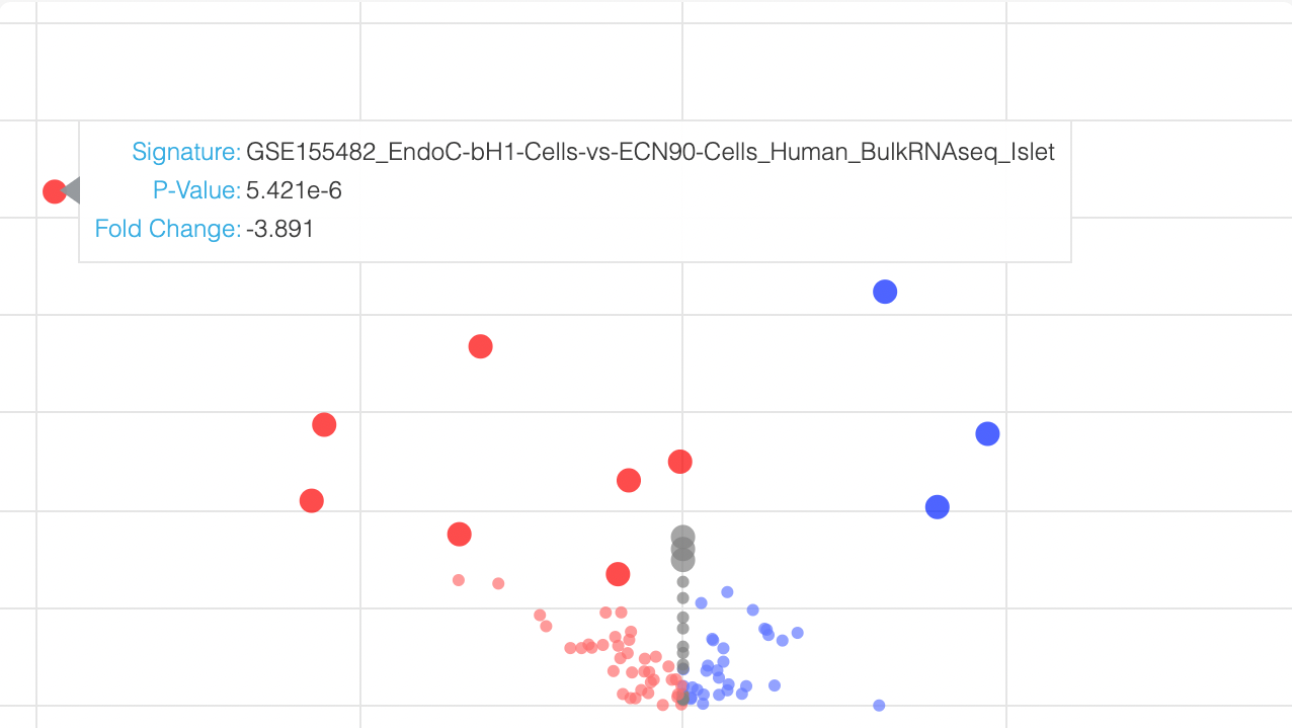
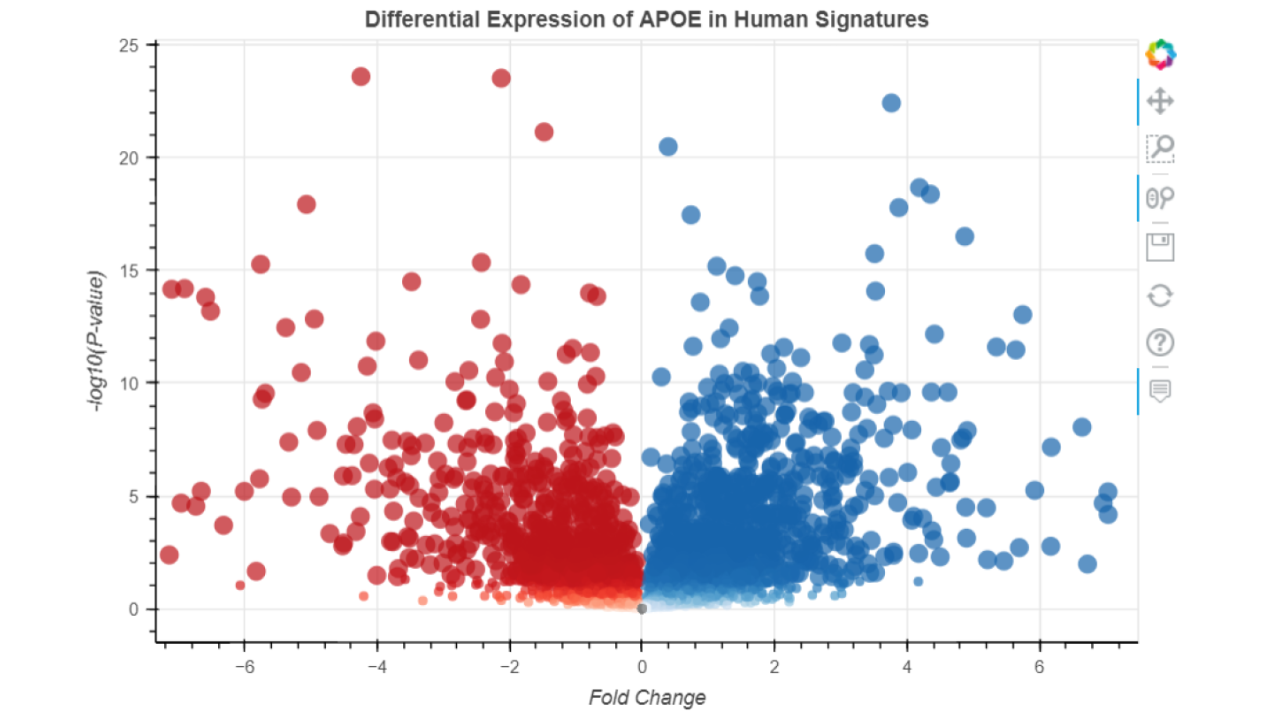
This module provides a volcano plot visualization of the expression levels of a given gene in various Type 2 Diabetes transcriptomics signatures. Users may enter in a single gene symbol as input; the output is a volcano plot which plots each T2D signature by gene-specific p-value (y-axis) and fold change (x-axis) as well as the corresponding tables available for download.

Under what conditions or perturbations is my gene regulated?
This Appyter can be used to find conditions to maximally up/down regulate the expression of a gene in human/mouse based on curated GEO studies

Is there a knockout mouse for my gene and does it show any phenotypes?
Query the MGI database through MouseMine to find phenotypes associated with the knockout of the input gene symbol. The produced table also links to the gene page on MGI, the PubMed articles from which they are sourced, and defintions for the returned phenotypes.

 Chatbot
 Single Gene Queries
 Gene Set Queries
 Bulk Studies
 Single Cell Studies
 Hypotheses
 Resources
 Contribute
 Downloads
 About
About
 Help
Help


