Chatbot
 Single Gene Queries
 Gene Set Queries
 Bulk Studies
 Single Cell Studies
 Hypotheses
 Resources
 Contribute
 Downloads
 About
About
 Help
Help
D2H2 offers a variety of ways to explore the curated collection of human and mouse studies processed from GEO.
Functionality Available from the Home
The D2H2 home page features several modules that enable users to explore knowledge about a single gene or a gene set in the context of diabetes-related signatures from the processed GEO studies.
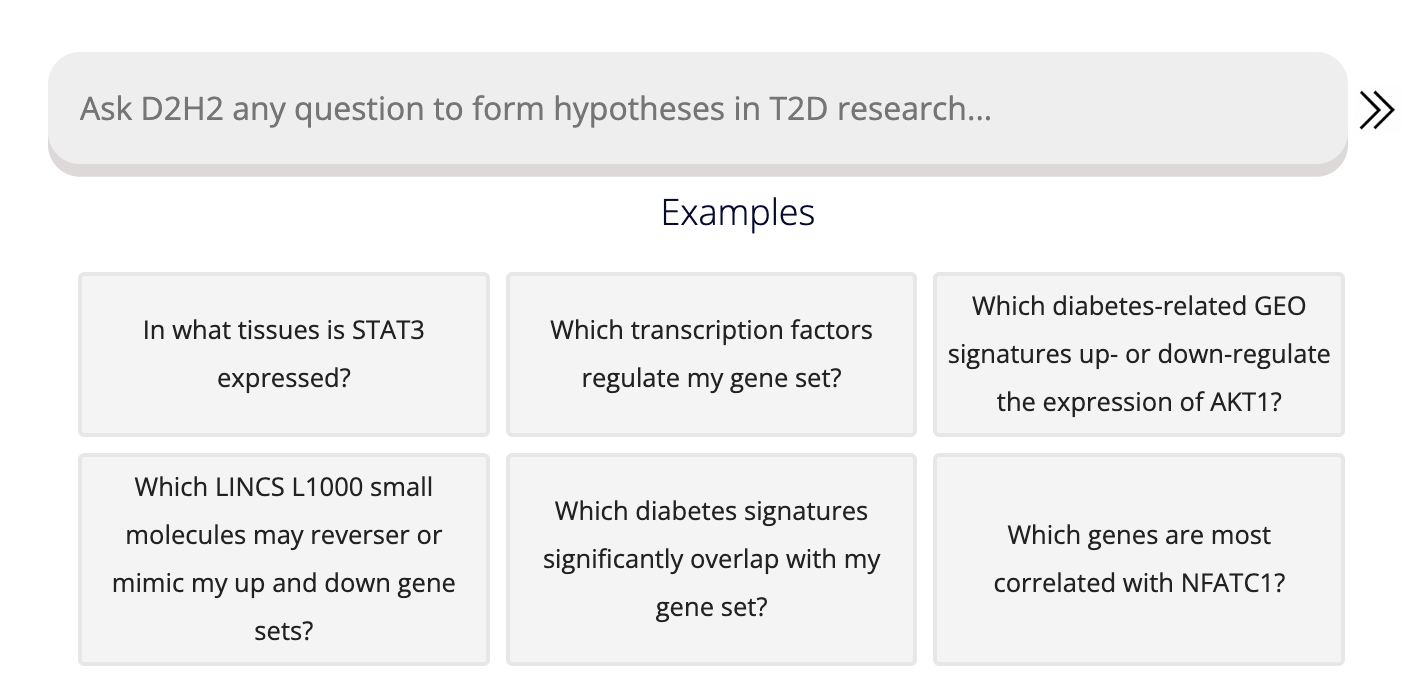
On the left side of the home page, users may enter gene or gene set related queries. The D2H2 AI-powered chatbot interprets user queries and attempts to answer their question, providing its methods and asking for any required parameters:
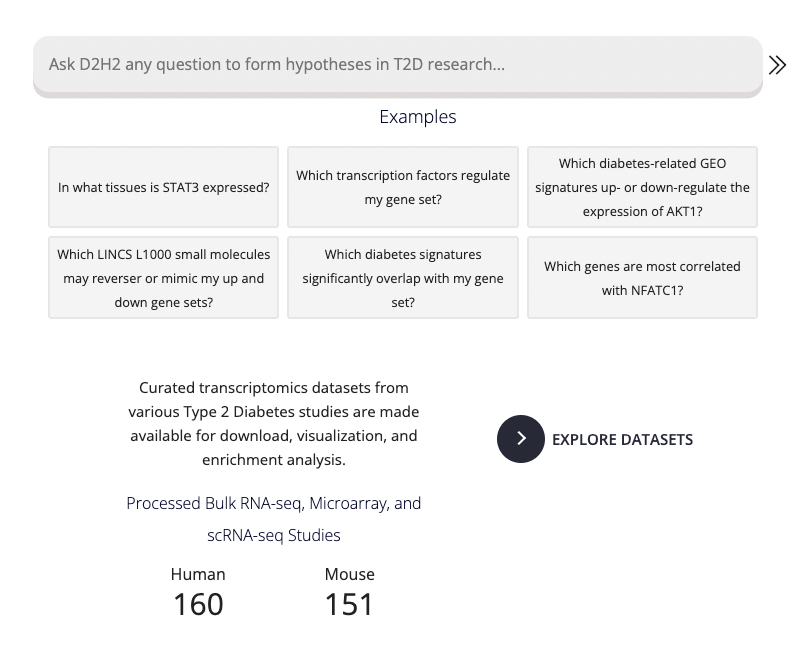
Users may select any of the example queries below the input bar to demonstrate a portion of functionality available through the chat. Additionally, all processes are available in descrete modules on the Single Gene Queries and the Gene Set Queries pages. The right side of the home page highlights some of the features available from the gene queries pages as well as from the GEO-study dedicated pages.
Processed GEO Studies
Users can explore landing pages about each processed GEO study in D2H2. These landing pages can be accessed by looking at the returned top ranked signatures from a single gene query available from the D2H2 home page. The second option to access these pages is through the navigation bar at the top of the site. Users can click on either the Bulk RNA-seq and Microarray Studies or the scRNA-seq Studies navigation tab, and then be presented with the option to browse through the collection of mouse or human studies. The number of processed studies is shown per species as seen below.

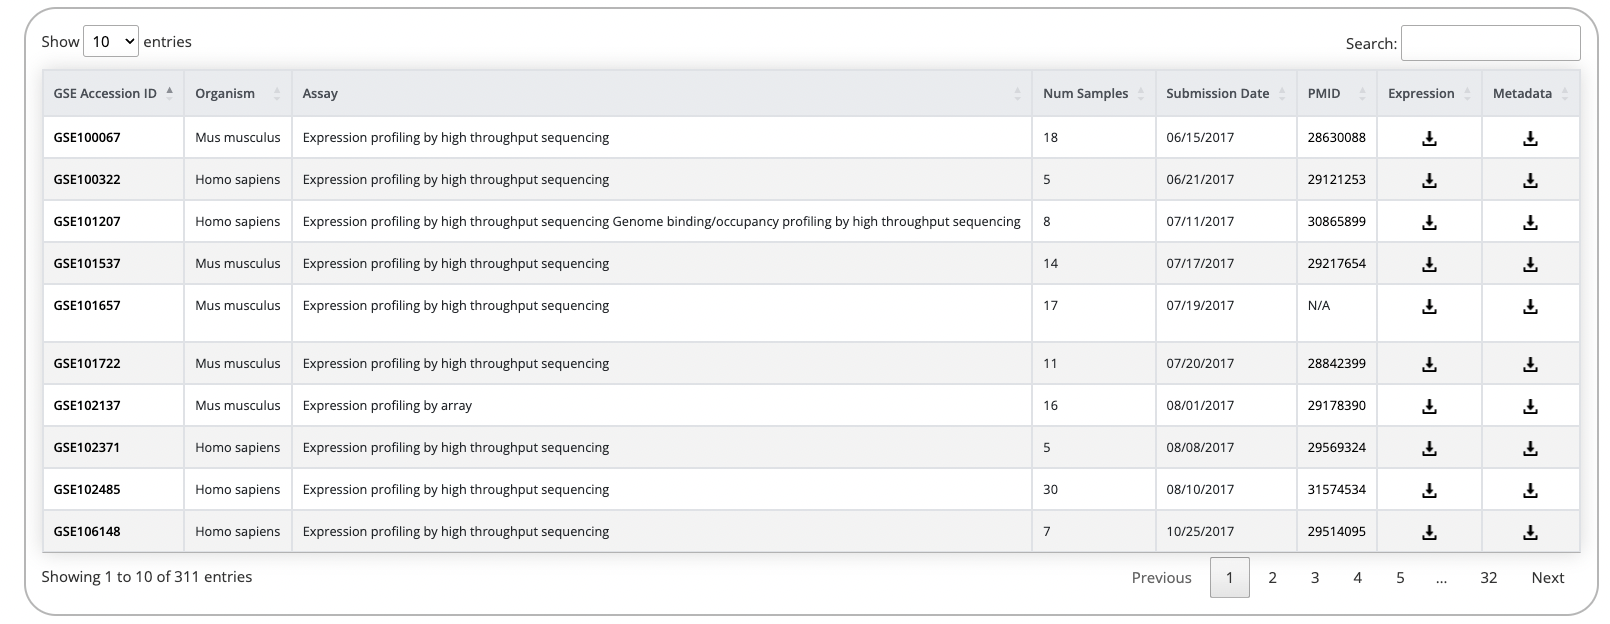
After selecting the species, a table with the available studies to browse and view will be displayed.
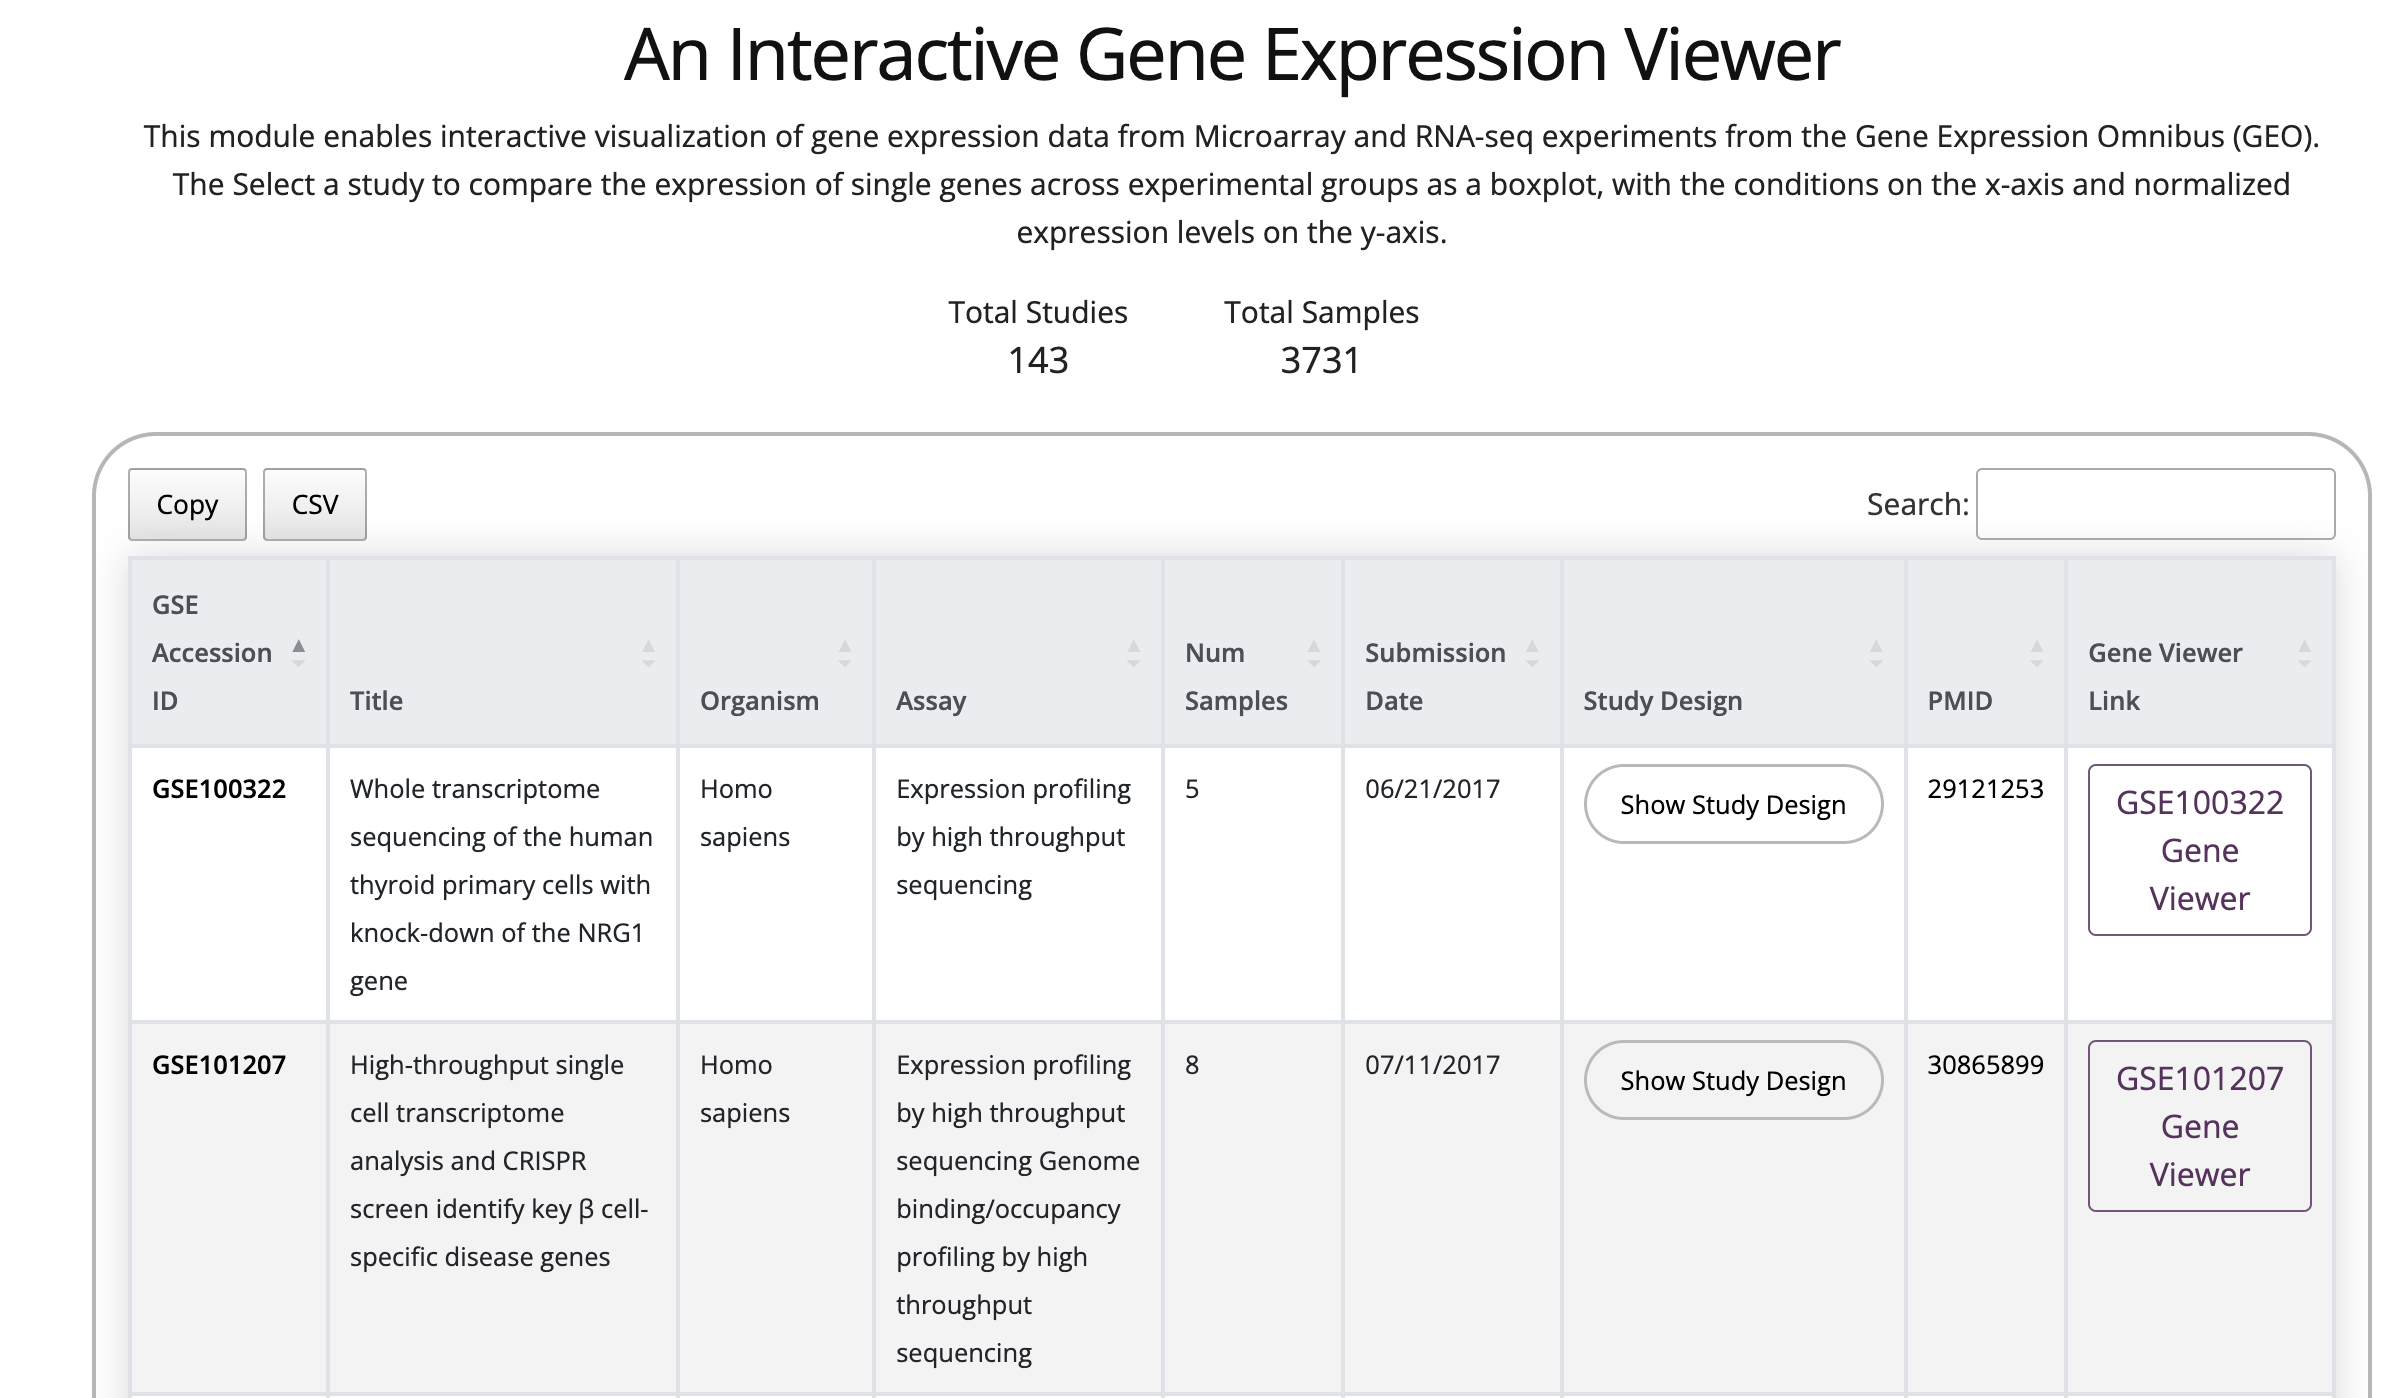
Here users can see the study's GEO ID (GSE), which is linked to the applicable page on GEO, as well as additional information about each study. Clicking the show study design will expand the entry for the study to show additional information about the study design. Clicking the purple Gene Viewer button to the far right of the table will open the study landing page which contains several features to explore the processed data in more detail.
Sample Visualization
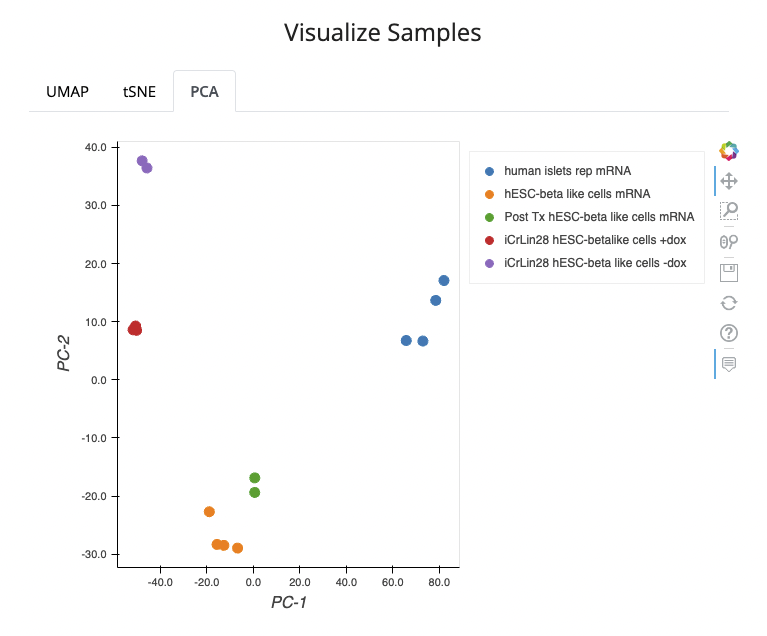
All studies are clustered using the leiden clustering algorithm and visualized with UMAP, t-SNE, or PCA. For the single cell studies the selected condition with its precomputed clusters are visualized.
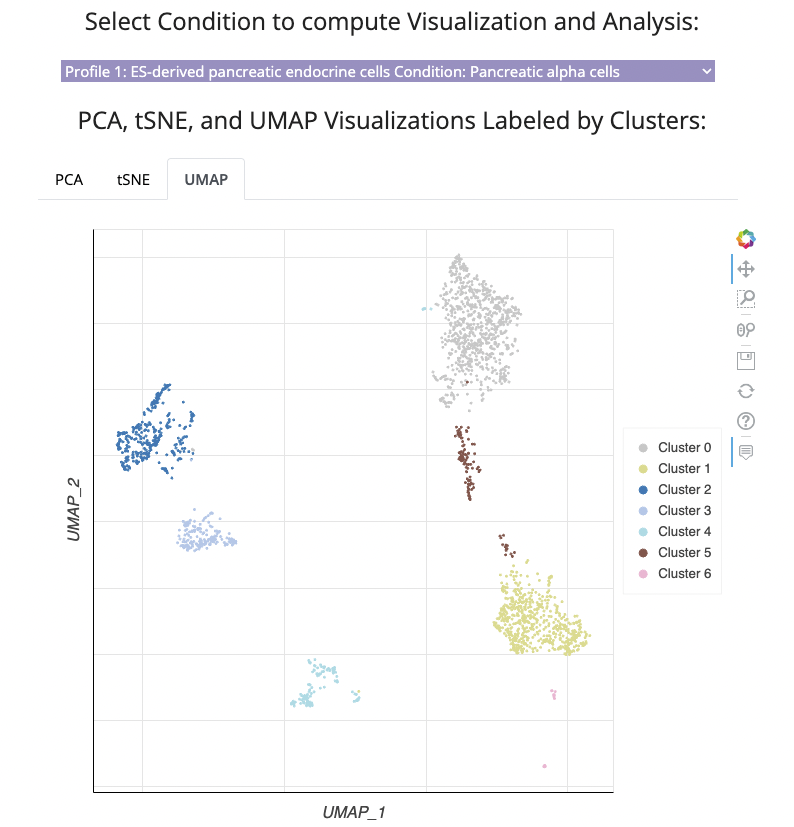
For the Bulk RNA-seq and Microarray Studies, all distinct conditions are visualized.
Customized Boxplot Viewer
For each study's dedicated landing page there is a customized boxplot viewer. Users can view the expression of a single gene across the various conditions or clusters of the study. The autocomplete dropbox above the boxplot facilitates users to change the gene to view and the table to the right enables selecting and deselecting the conditions to visualize.

Users can also see a summary of the study, and mechanisms to perform differential gene expression analysis on the fly.


For the Bulk RNA-seq and Microarray Studies after selecting a control and a perturbation condition, differential gene expression analysis can be performed with DESeq2 or Characteristic Direction natively on the site. For the single cell RNA-seq studies, differential gene expression is performed with either wilcoxon or DESeq2 through subsampling from each cluster and comparing the selected cluster to the rest. The differential expression analysis can take somewhere between 30 seconds to a few minutes depending on how many samples are contained in the selected conditions or clusters. Also for the Bulk RNA-seq studies, users can compare two conditions in the Bulk-RNA-seq Appyter which includes additional analyses and visualizations.
After the analysis completes, the user is presented with an interactive volcano plot, as shown below:
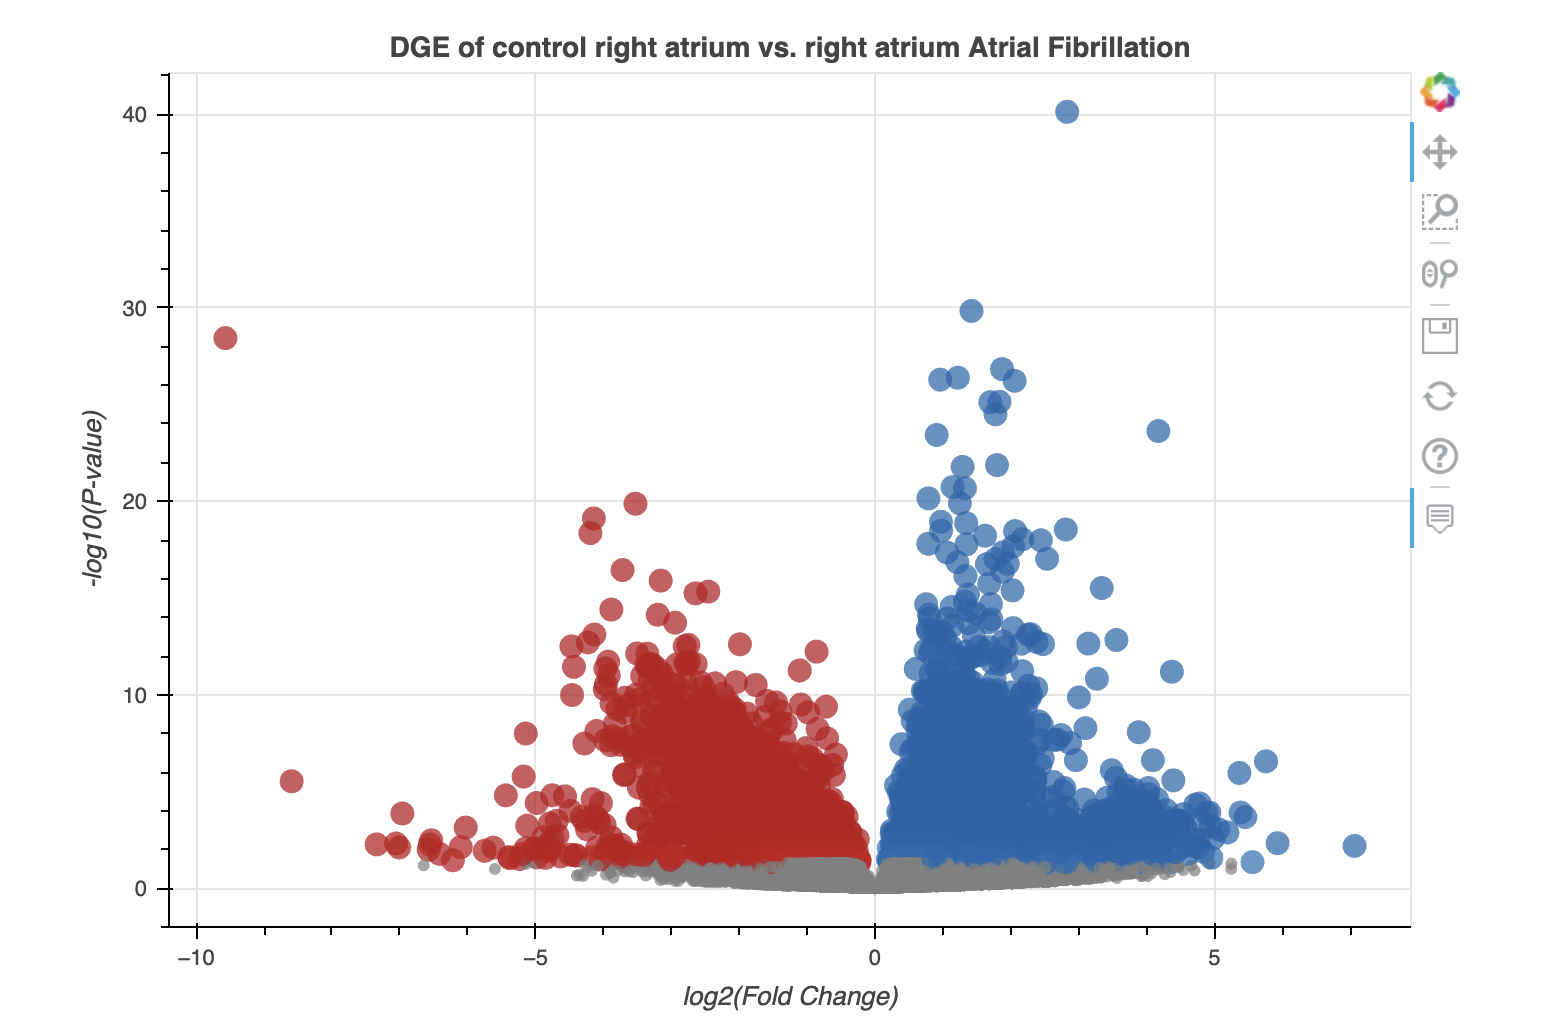
As well as the corresponding table:

Clicking on any of the genes in the left-most column in this table opens the Single Gene Queries page with the gene name loaded into the various querying options on this web-page. Additionally, users can submit a specified number of genes from the table, that satisfy the selected adjusted p-value threshold, to the Gene Set Queries page. The table can be sorted in ascending or descending order, by clicking on any of the table columns headers. The table is also available for download in CSV format by clicking the button at the top left of the table.
Single Gene and Gene Set Query Pages
D2H2 offers numerous gene and gene set related modules, harmonizing information from a variety of sources. The first module available on the Single Gene Queries page, allows users to view the expression of a single gene across all the processed bulk RNA-seq and microarray studies hosted on D2H2. After selecting or typing a gene name and clicking on the generate plot button, an interactive volcano plot and corresponding tables will appear below the module. See an example below:
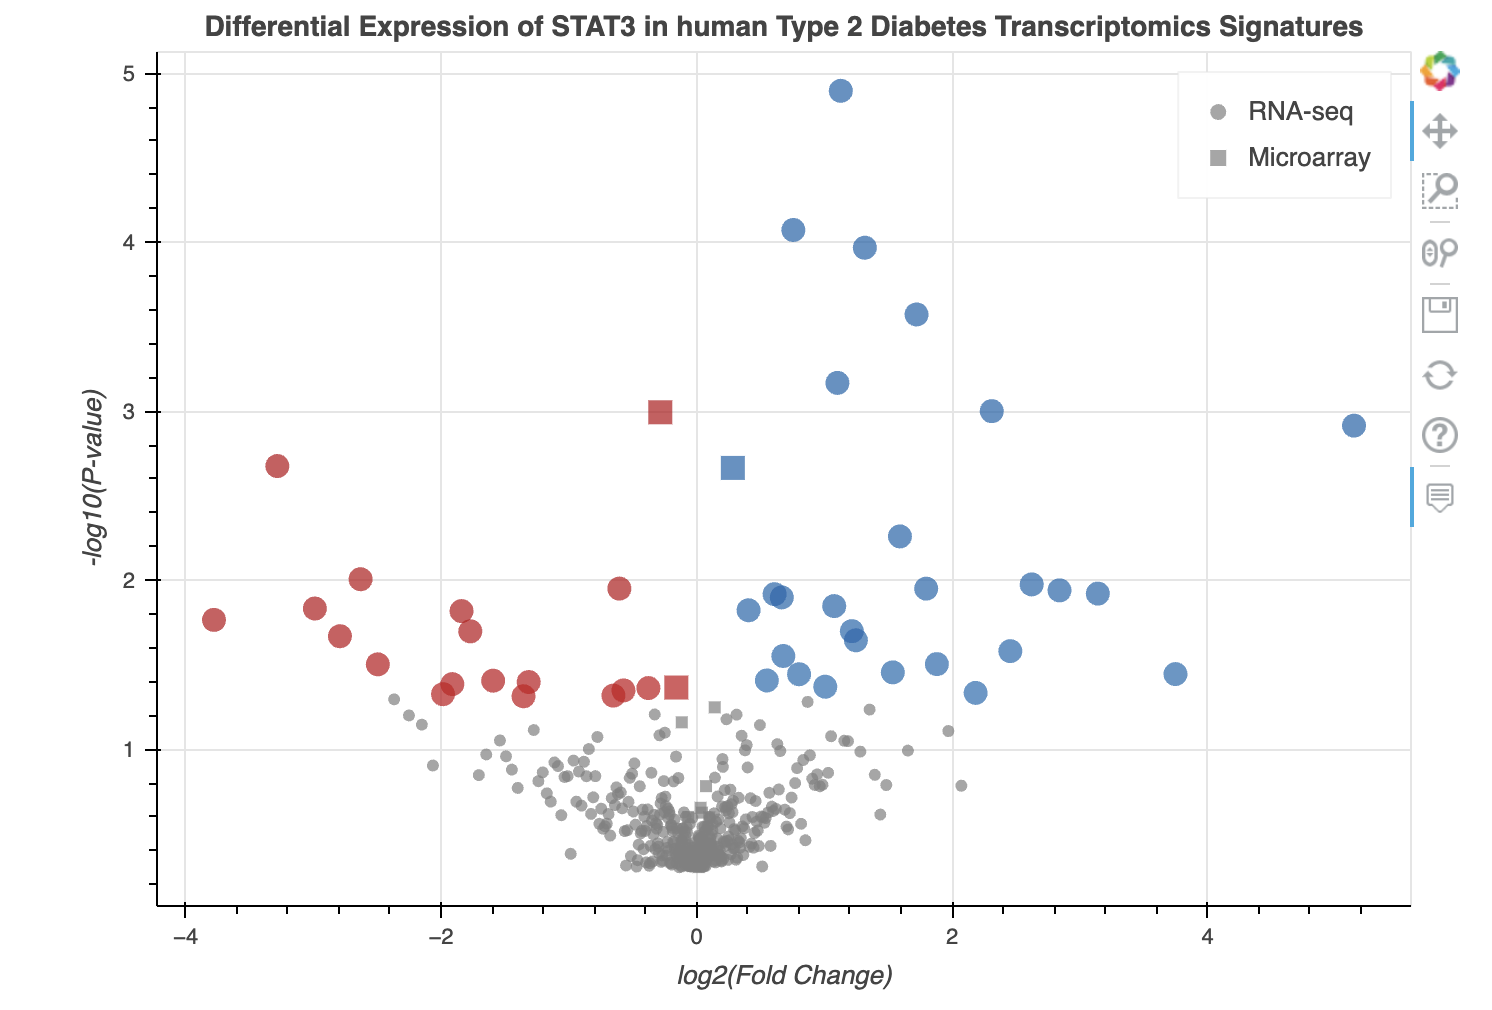
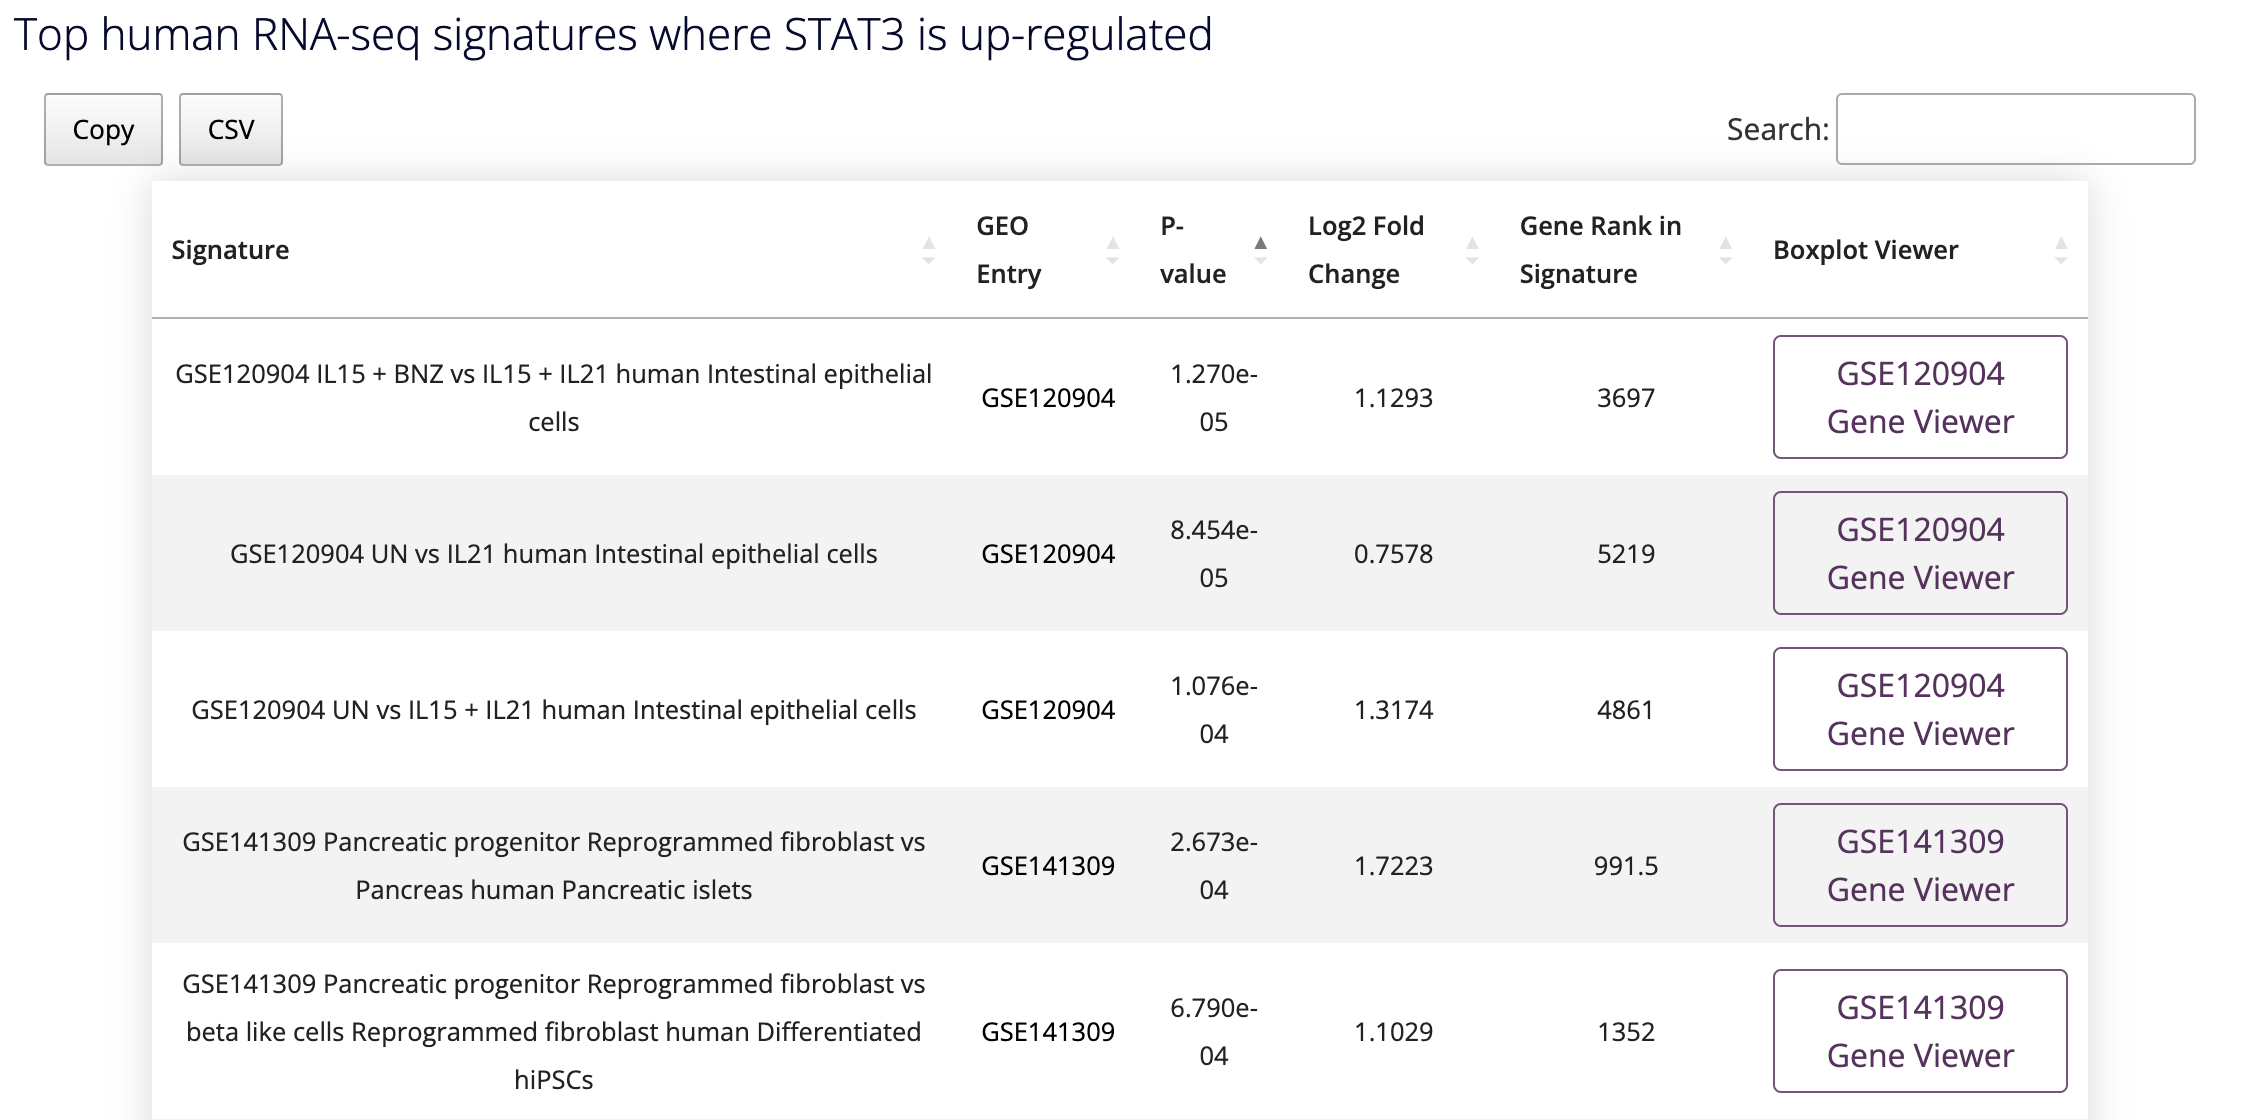
By hovering over the points in the volcano plot you can see for which signatures are most significant in up- or down-regulating the expression of the queried gene. Clicking on the GSE number in the table will take the user to the study entry on GEO, and clicking on the Gene Viewer button to the far right of the table will navigate the browser to a dedicated page for the study that contains a customized box plot viewer that displays the expression of the queried gene across samples and conditions in the selected study.
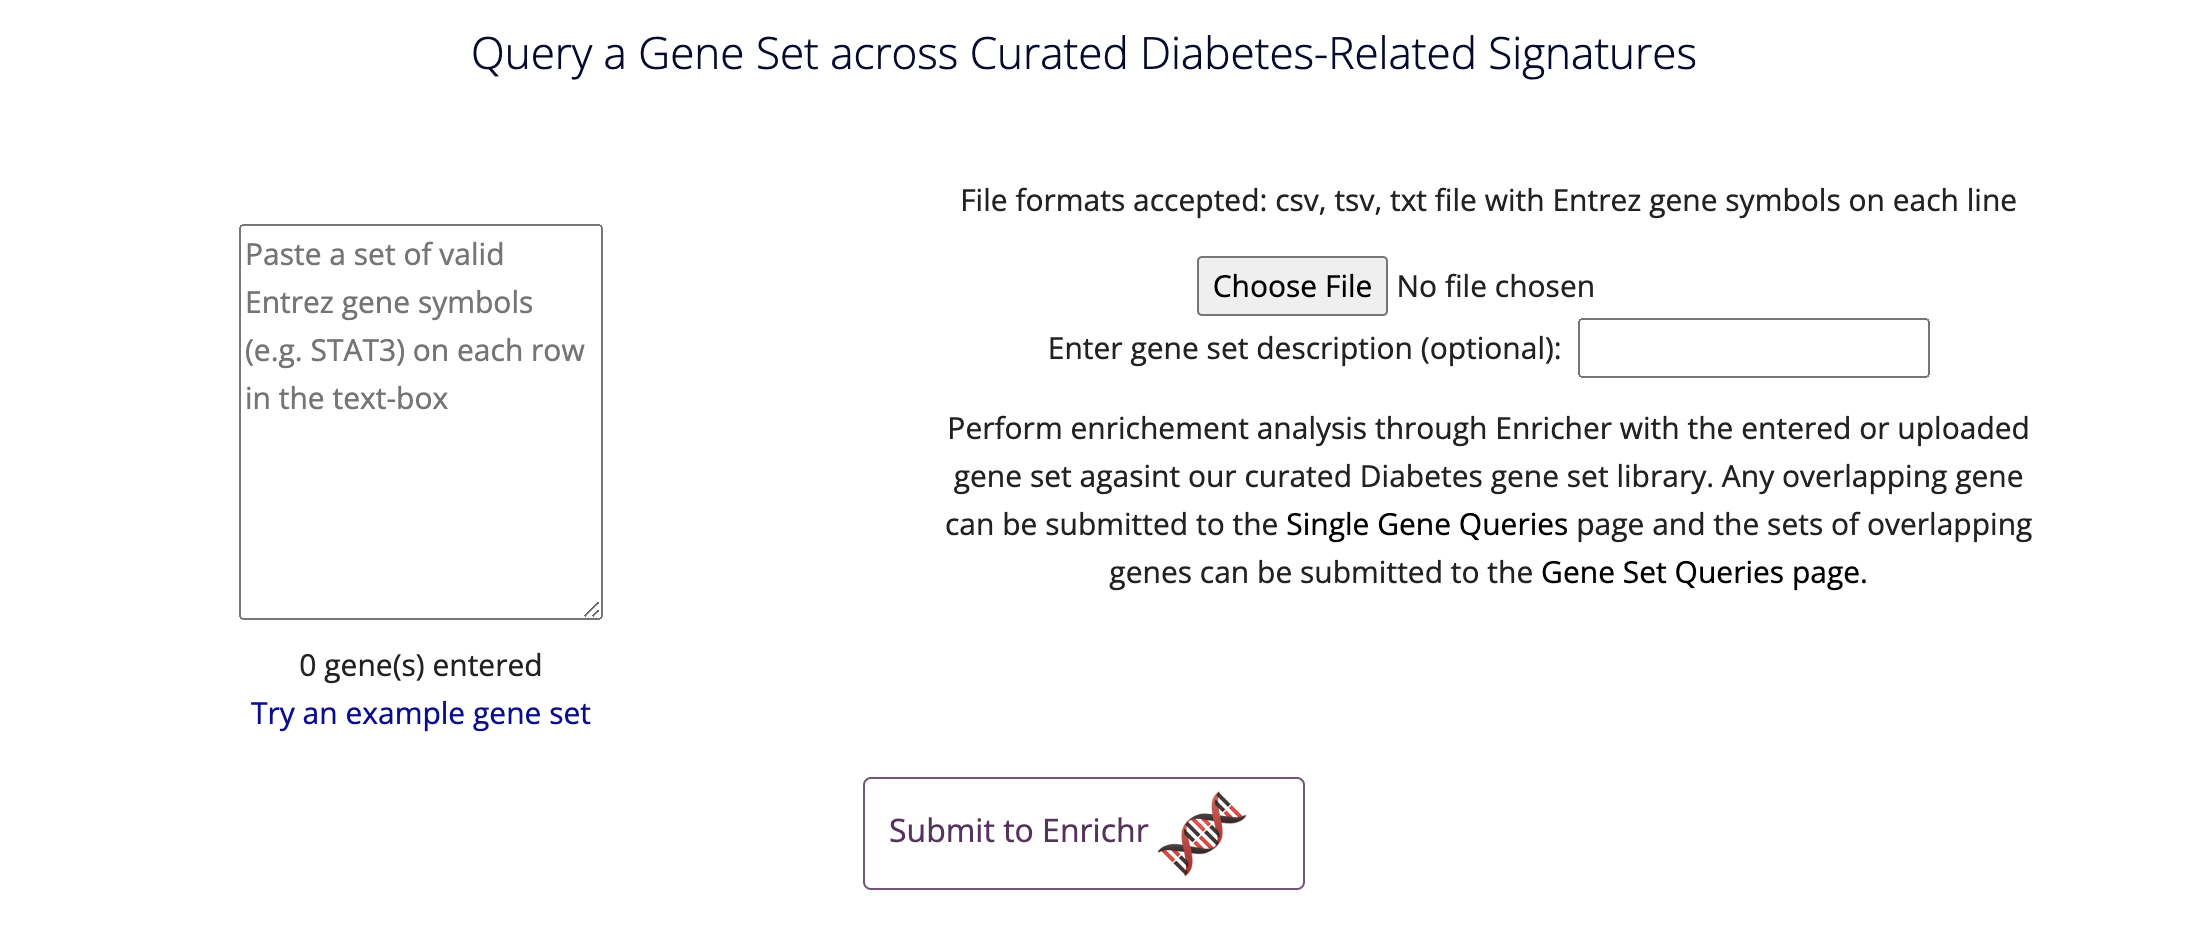
Also, on the home page, there is a module where users can query a gene set against a diabetes-related gene set library:
Here once a gene set is submitted, a table is produced with the most significantly enriched diabetes-related signatures:

Users can expand the content of the table to see the overlapping genes by clicking the white button in the second to last column of the results table. This will reveal a comma-separated list of the overlapping genes as seen in the example below:
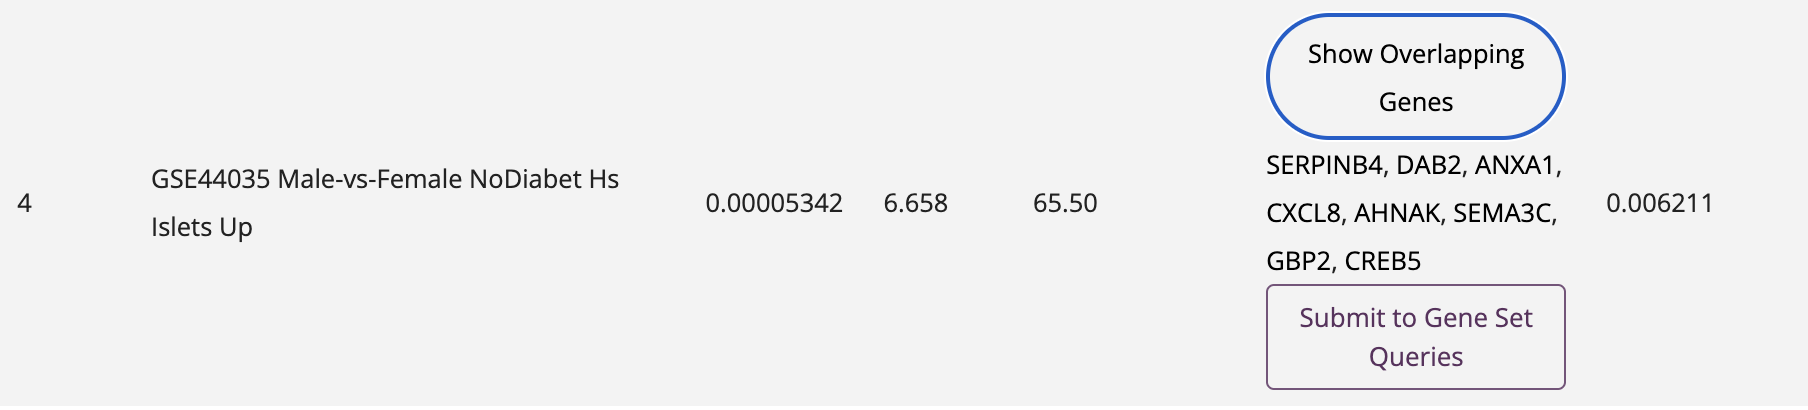
Users can further investigate these genes by submitting them to the Gene Set Queries by clicking on the purple button, or investigate a single gene by clicking it in the list. This click will open the Single Gene Queries page with the clicked gene populating the various query fields on the page.
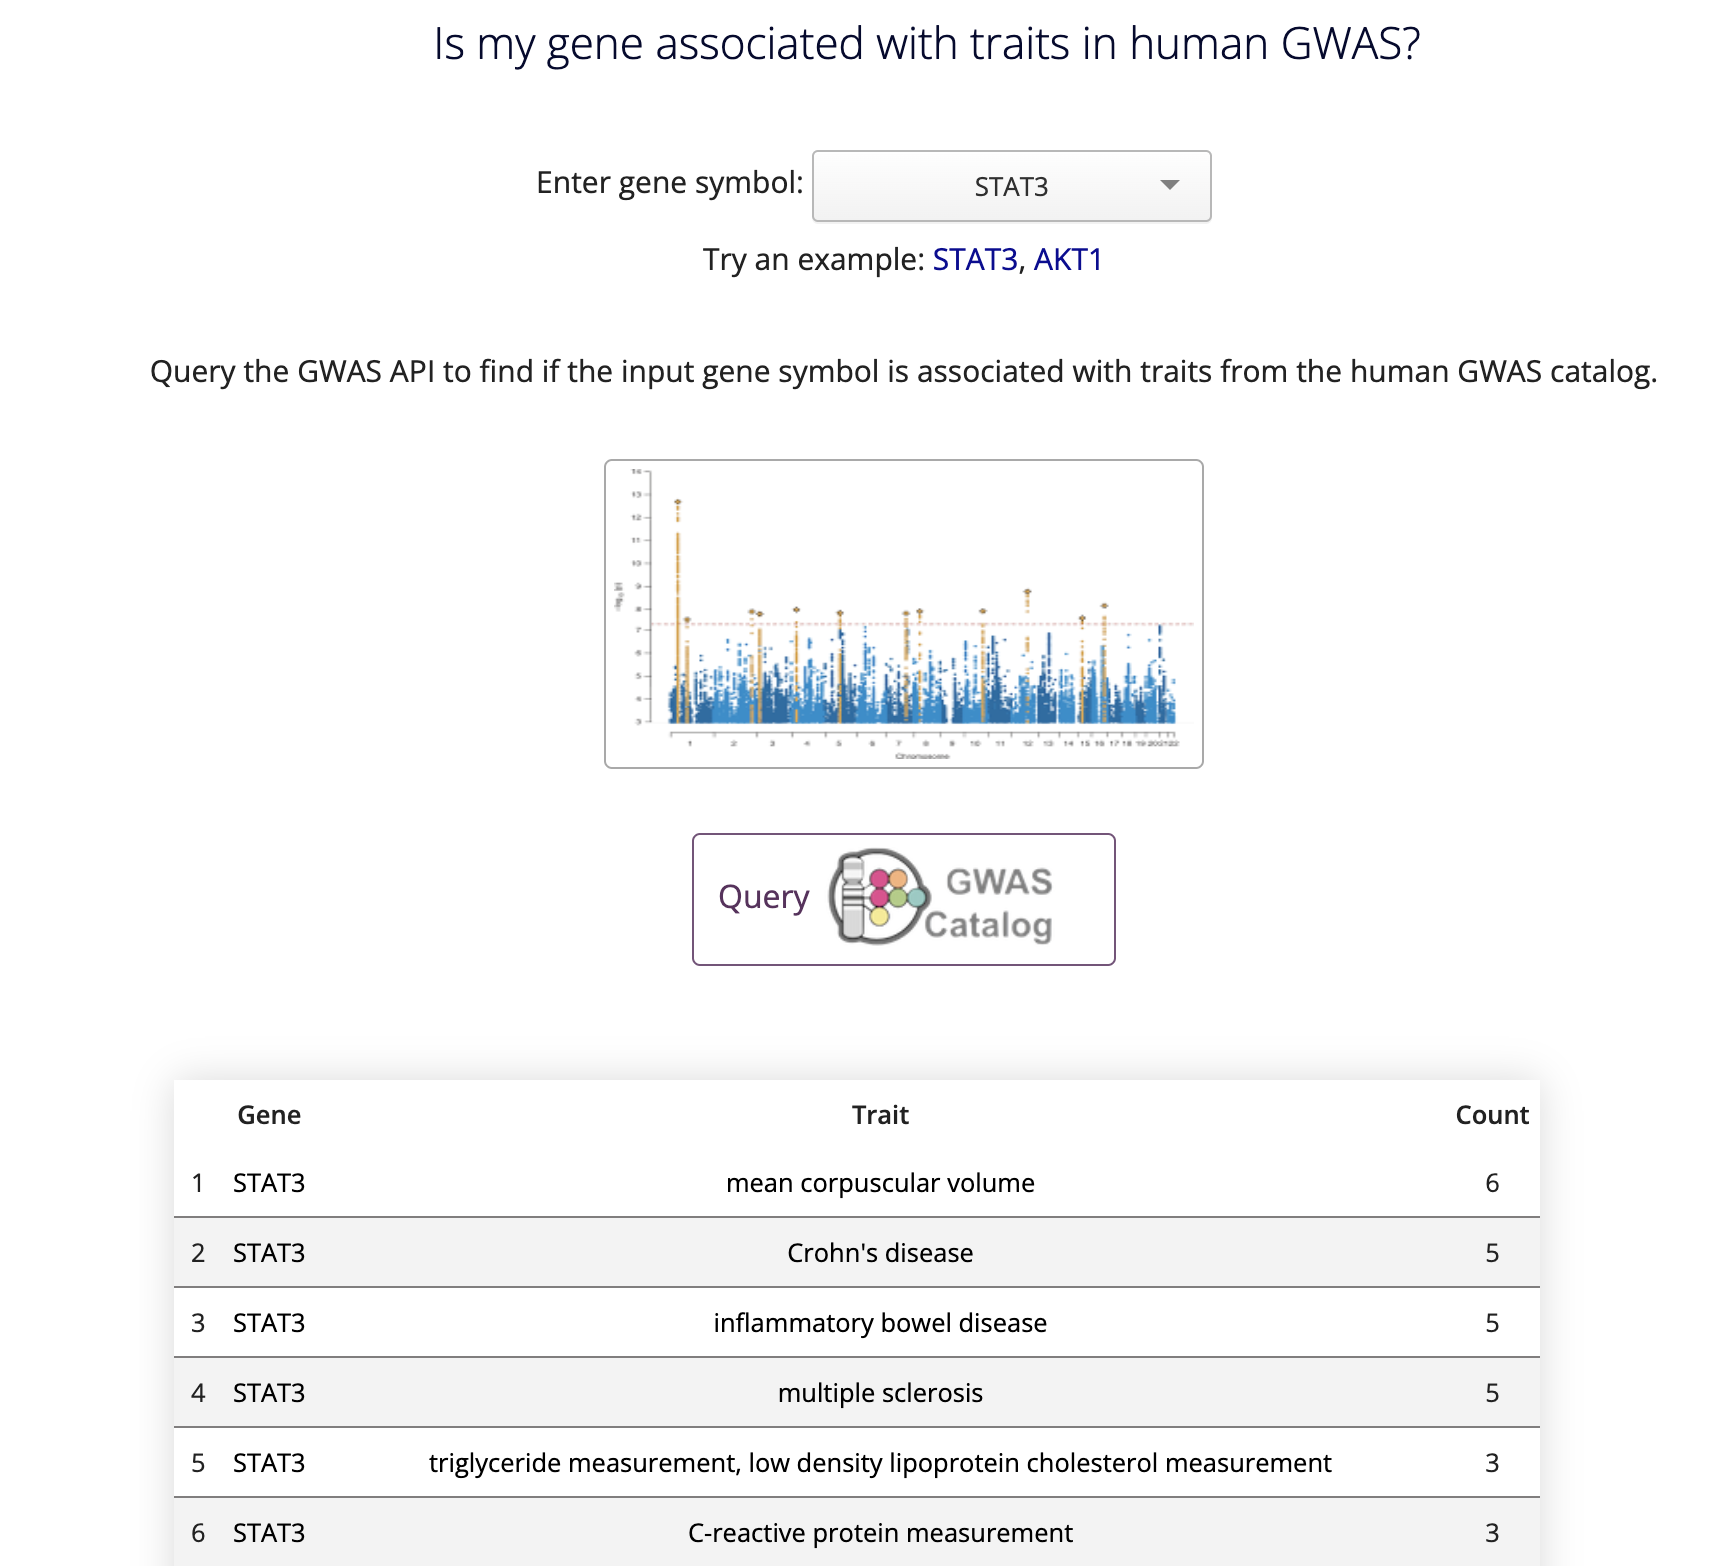
Several tools and search engines are available from D2H2 to provide information about single genes and gene sets. The currently available queries can be accessed from the home page:
Or after selecting one of the query pages from the navigation bar, the available queries will appear on the left of the page, any of which can be selected and you will be navigated to the corresponding module.

On the Single Gene Queries page, entering a gene will propagate in the input field for all the questions so information about the gene of interest can be investigated more quickly. Here is an example of a single gene query module. On the button, it says 'Start a new appyter in' Appyters. This conveys that this will open a new page in Appyters.
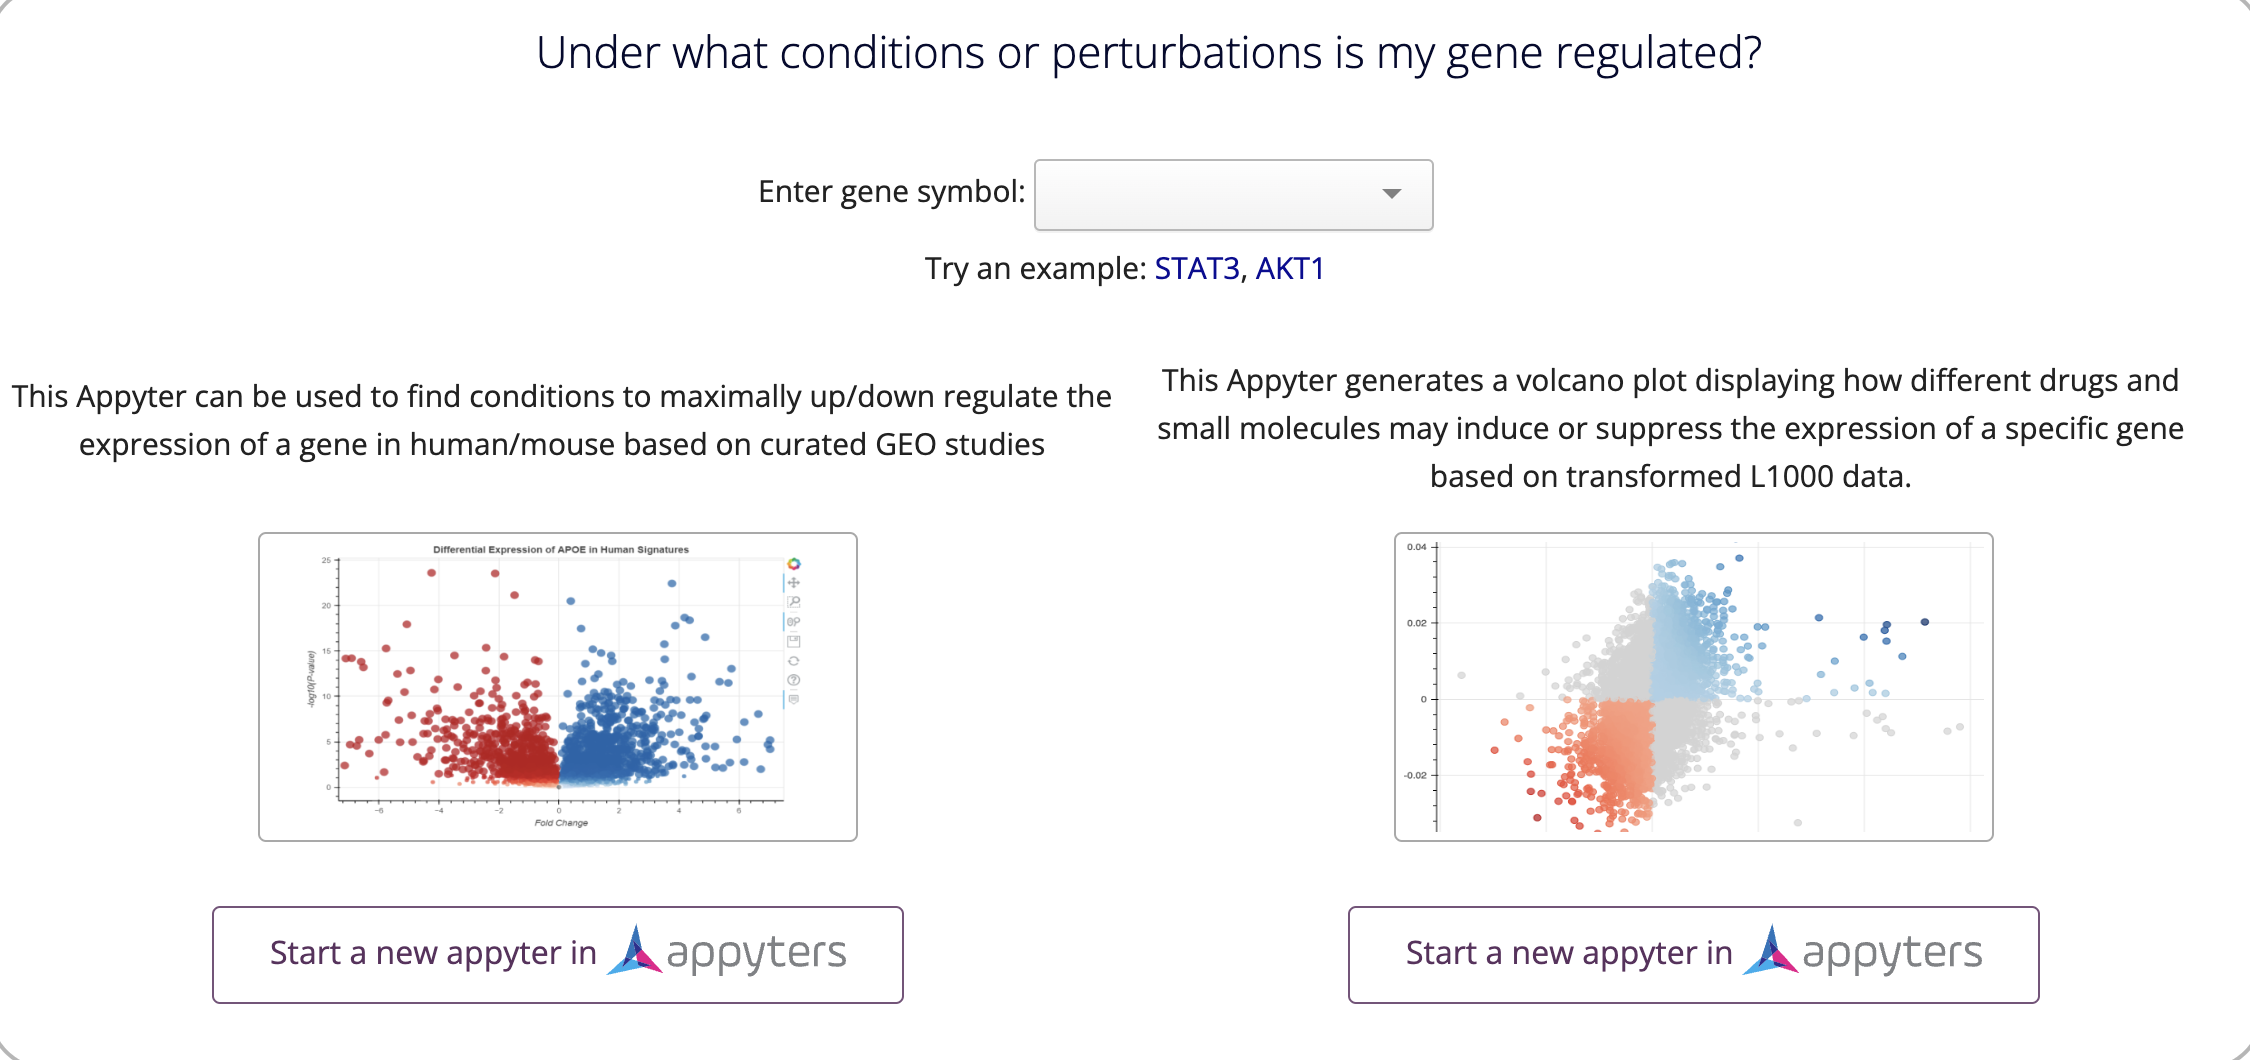
This is different than the keyword 'Query' in the button, which conveys that the information will be displayed directly on the site as pictured below:
For the gene set queries page, a text box is provided to paste line-separated valid Entrez gene symbols. Gene sets can also be uploaded as files in CSV, TSV, and TXT formats.

An example gene set query module is shown above. For the SigCom LINCS, the user may also choose to submit an up-and-down gene set by selecting the purple button below the file entry field.
Additional Features
Resources
The Resources page provides a variety of diabetes-related databases and portals for researchers. The table is downloadable and searchable.

Downloads
The downloads page provides the processed diabetes-related signatures which are queried from the modules on the Home page as either CSV or feather files.
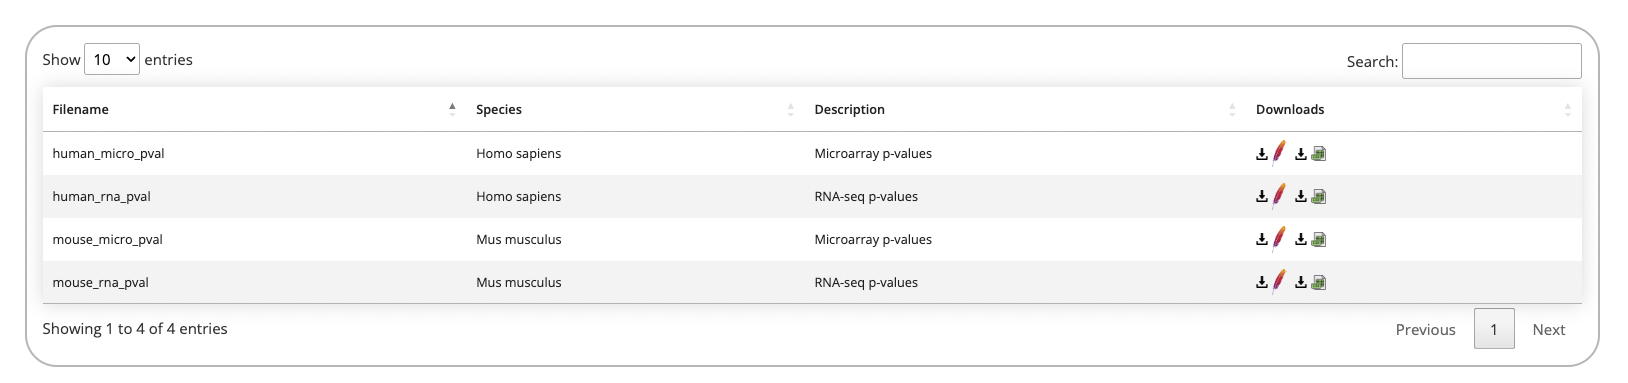
Addtionally, expression and metadata files are available for each study hosted on D2H2.