Chatbot
 Single Gene Queries
 Gene Set Queries
 Bulk Studies
 Single Cell Studies
 Hypotheses
 Resources
 Contribute
 Downloads
 About
About
 Help
Help
Diabetes Data and Hypothesis Hub (D2H2)
A platform that facilitates data-driven hypothesis generation for the diabetes and related metabolic disorder research community.


ICE status:
Peer connection status:
Signaling status:
Streaming status:


Examples
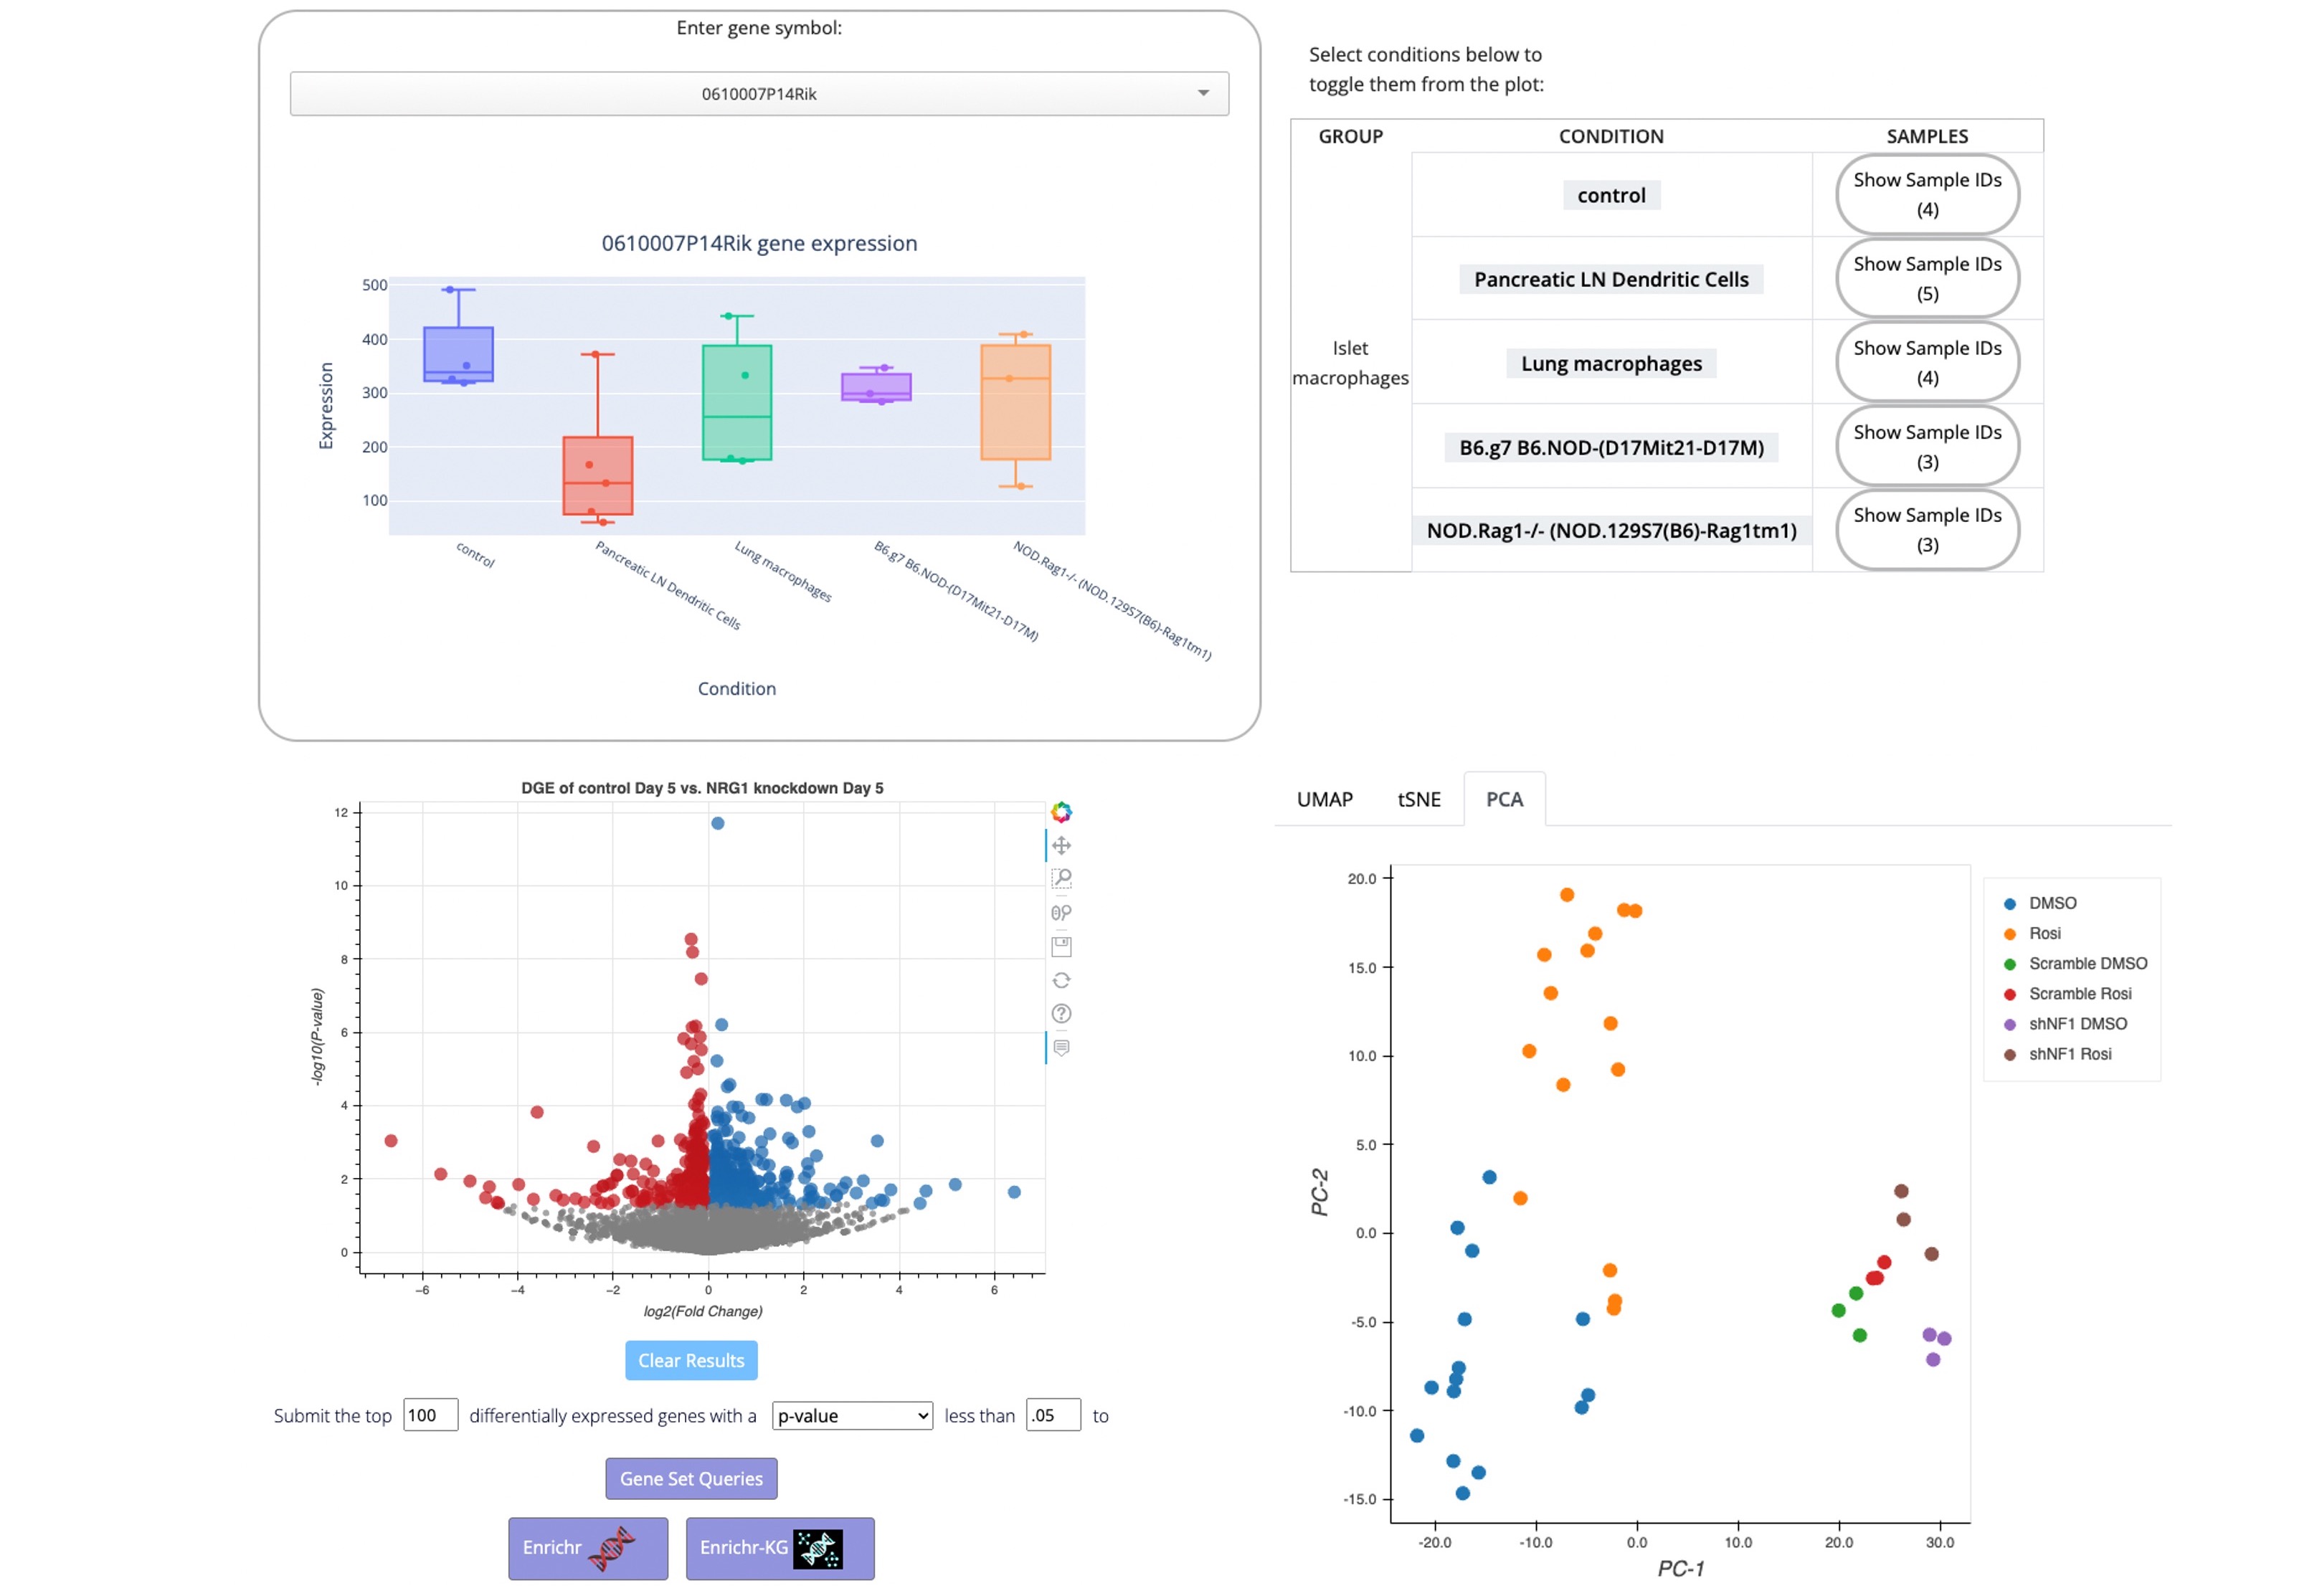
Explore a collection of curated diabetes related Bulk-RNA-seq and microarray studies manually extracted and processed from NCBI's GEO. The expression level of single genes across conditions is visualized as a customized box plot viewer; the samples can be visualized as UMAP, tSNE and PCA plots; and users cam compute differential expression for any two conditions with replicates.
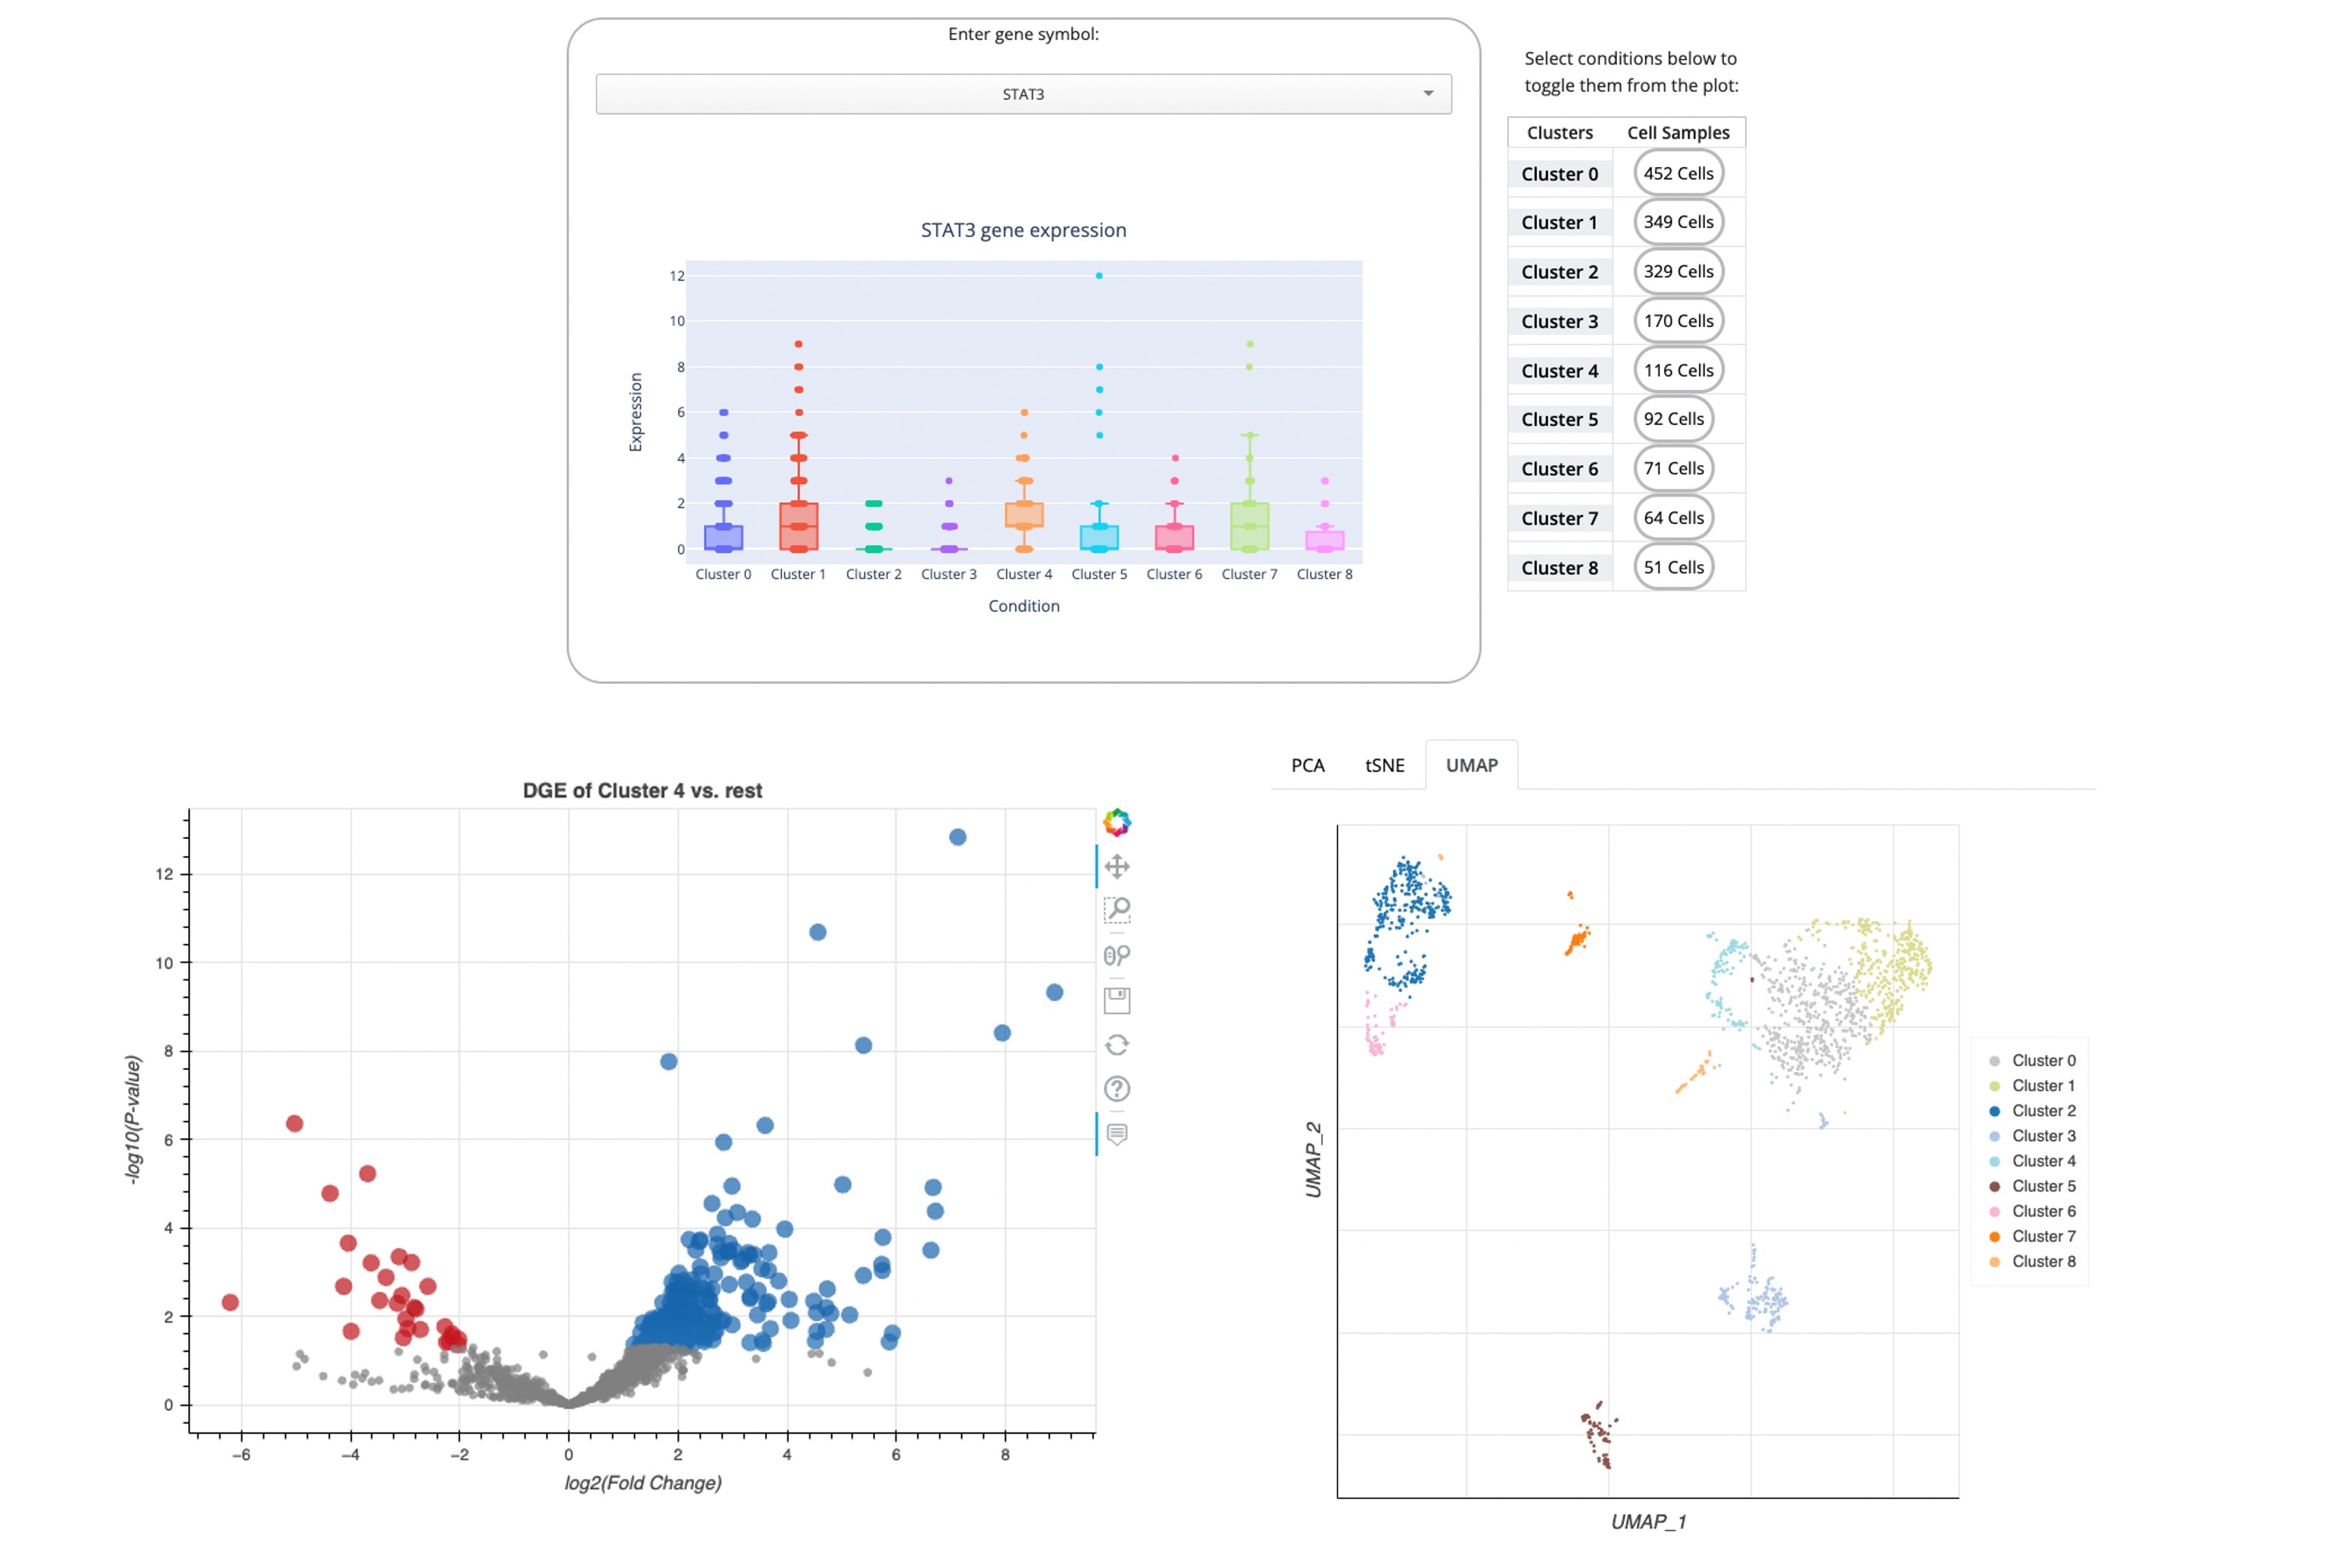
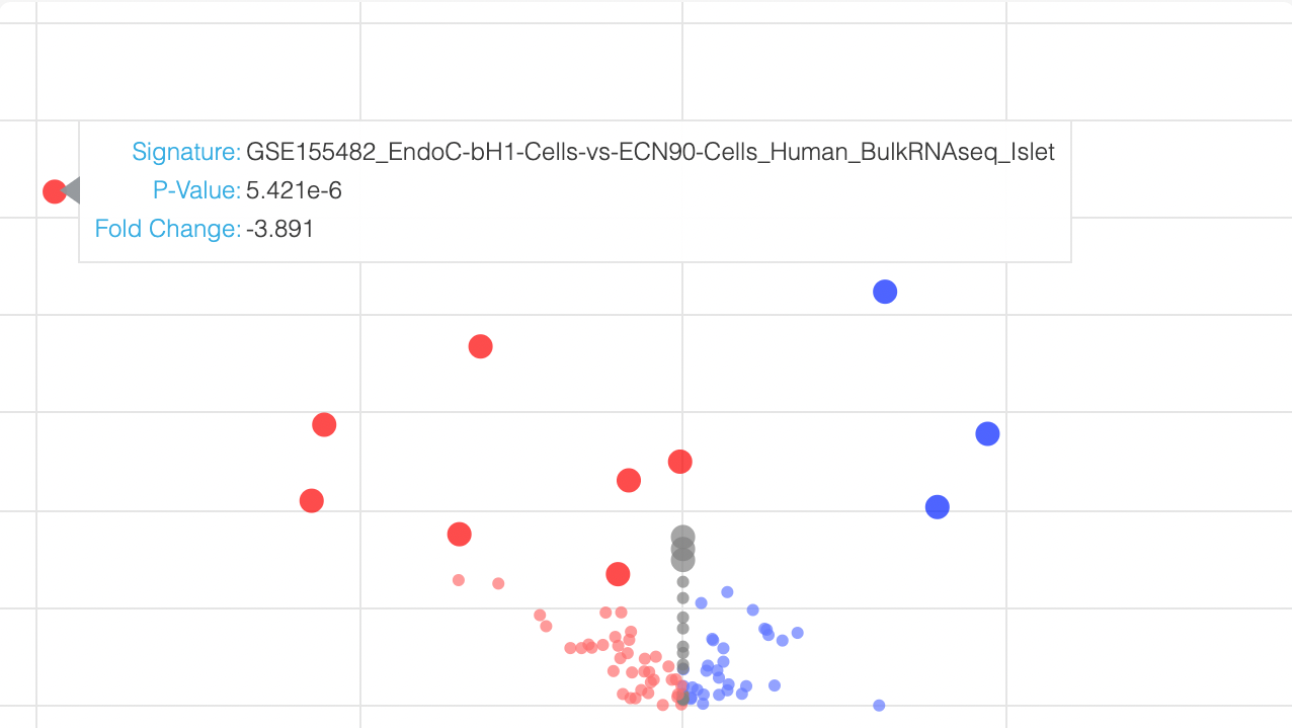
Explore a collection of curated diabetes related scRNA-seq studies extracted from NCBI's GEO. The expression of single genes across clusters of a chosen profile can be visualized as a customized box plot viewer; the single cells can be visualized in a UMAP, t-SNE and PCA; and users can compute differential expression for each automatically identified cluster